Kevin Sajan
Kevin Sajan
Full-Stack Developer and aspiring Data Scientist with hands-on experience in Python, cloud-native development, and data visualization. Skilled in building scalable applications, automating workflows, and transforming complex datasets into actionable insights using tools like Power BI, Azure, and React. Passionate about solving real-world problems at the intersection of AI, software engineering, and data science.
Toronto, Ontario, Canada
Work Experience
Software Developer
MacLean Engineering
Built 3D point cloud visualization system using Python, Open3D, and matplotlib with automated reporting and statistical analysis
Led full-stack development and DevOps deployment using Microsoft Azure
Developed Python GUI tools with Tkinter, threading, and i18n support, featuring custom animations
Created dynamic React components for machine data visualization and vehicle management
Designed and tested RESTful APIs with Node.js, Express, PostgreSQL, and Sequelize
Implemented automated testing with Jest and Cypress; deployed via Azure Kubernetes
Leveraged Power BI and analytics tools to extract insights from machine data
3D Point Cloud System
Live Demo
🔬 Technologies: Python, Open3D, matplotlib, Three.js
📊 Features: Real-time clustering, automated analysis, statistical reporting
⚡ Performance: Processing 5K+ points with sub-second response times
Financial Advisory & Tax Technician
Deloitte
Automated document linking and data entry using Puppeteer, improving efficiency and accuracy
Audited invoices and tax returns to identify discrepancies and resolve client-vendor disputes
Conducted financial analysis and supported compliance across multiple advisory engagements
Process Automation Analytics
Live Dashboard
🤖 Automation: Puppeteer web scraping, document processing
📋 Analysis: Invoice auditing, tax compliance, financial reporting
⚡ Results: 95%+ accuracy with 300+ hours saved quarterly
Currently Pursuing
Master of Data Science at University of Pittsburgh School of Computing and Information (2025-2027)
Focus: Data Modeling/Warehousing and AI in Data Management
Projects
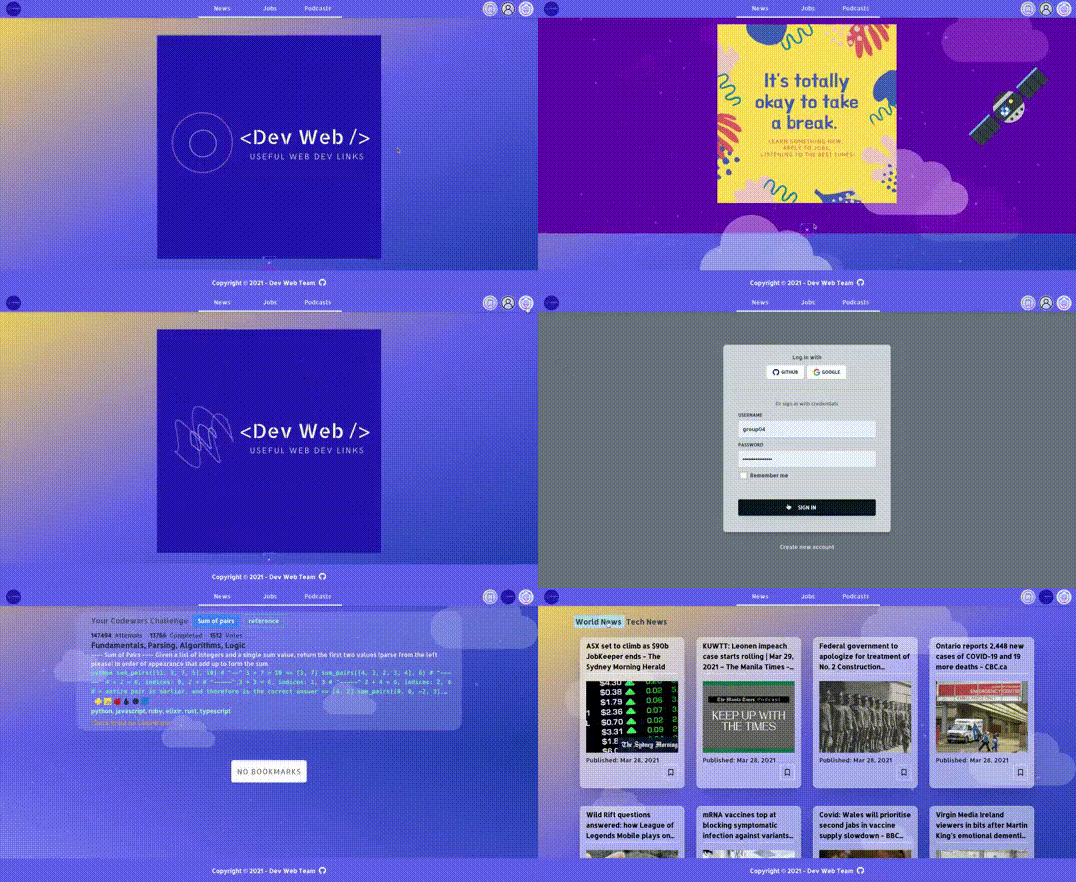
Dev Web
A useful portal for developers to find news, job postings, industry podcasts and relevant information all in one spot.
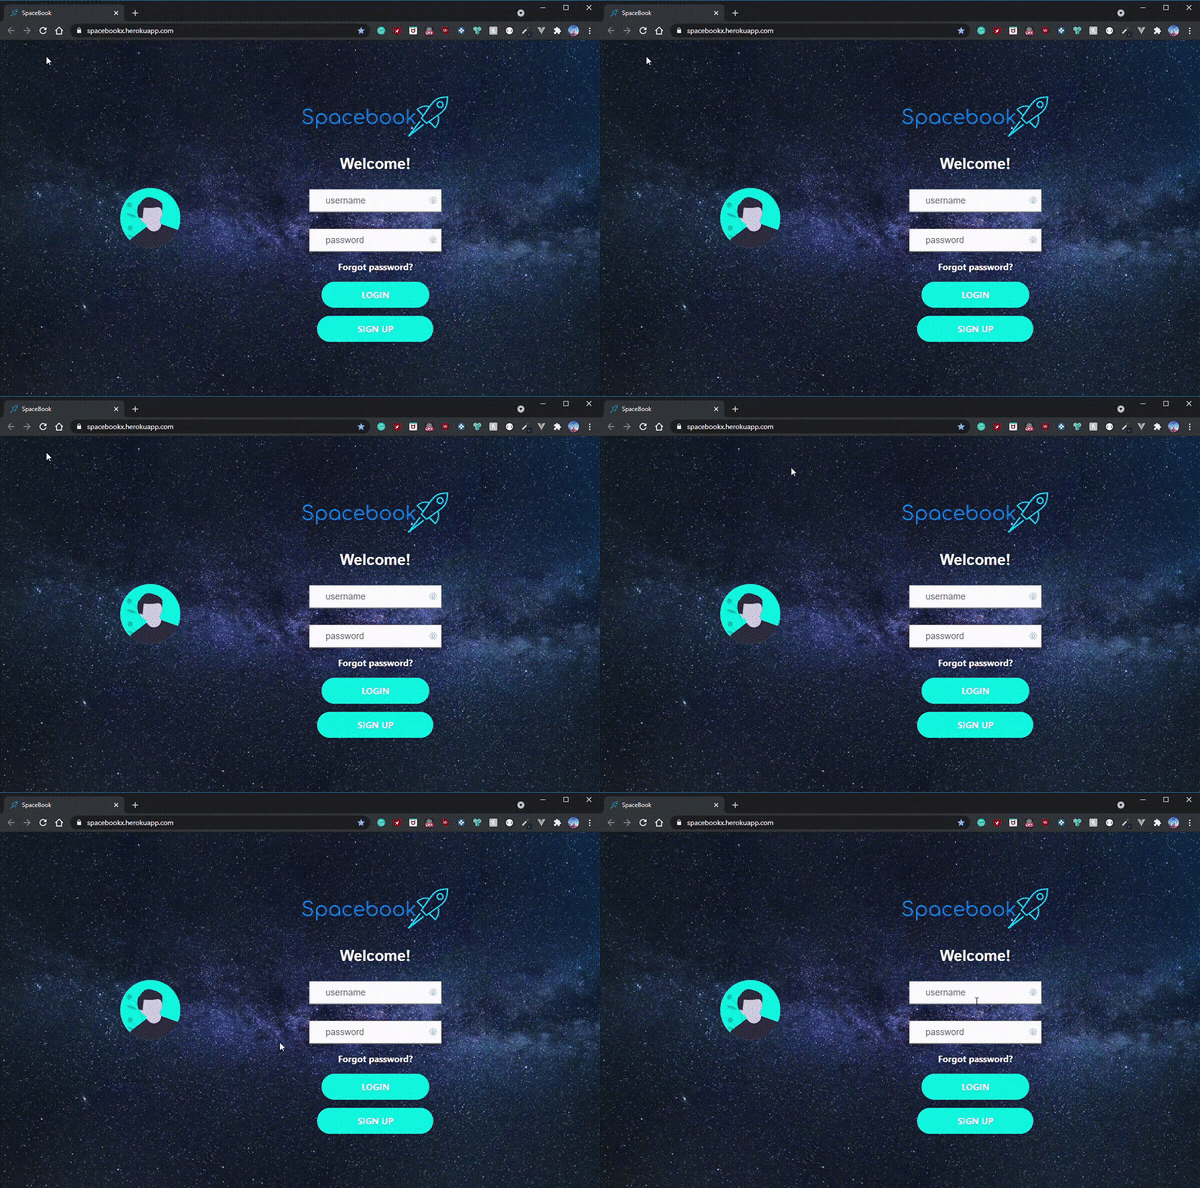
SpaceBook
Our own social media platform employing REST APIs to provide News, Gifs, Weather info whilst connecting with friends. Available on the Google Store
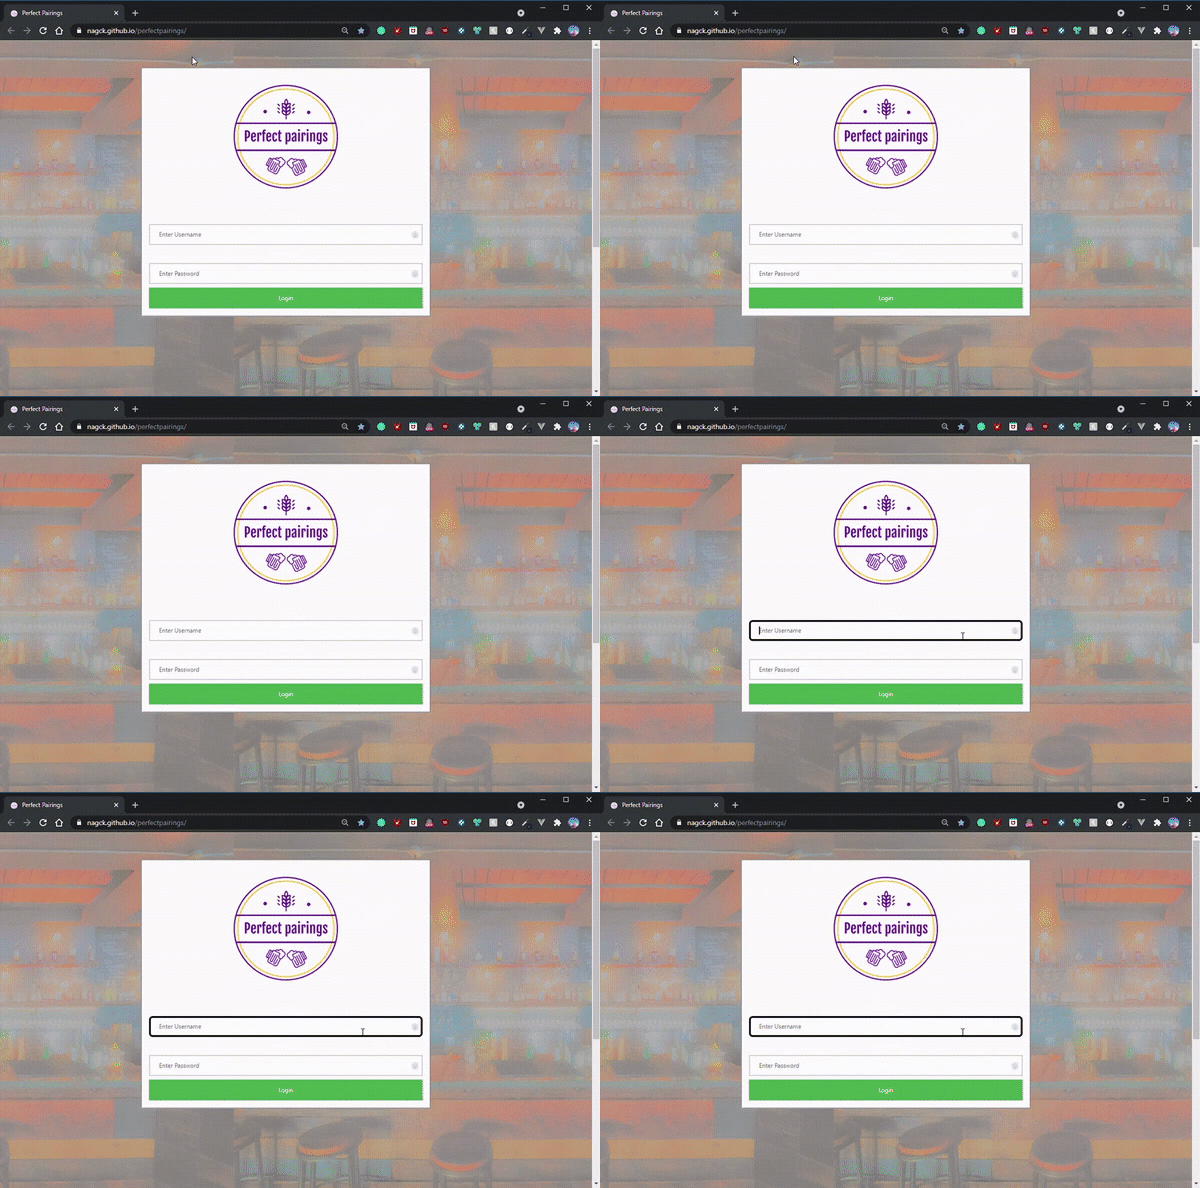
PerfectPairings
PerfectPairings will provide you with delicious food options and pair your selection with the perfect drink. Still not convinced? A GIF will Convince!

Google Books Searcher
Search Google for your favorite books without any ads or distractions inside a clean design!
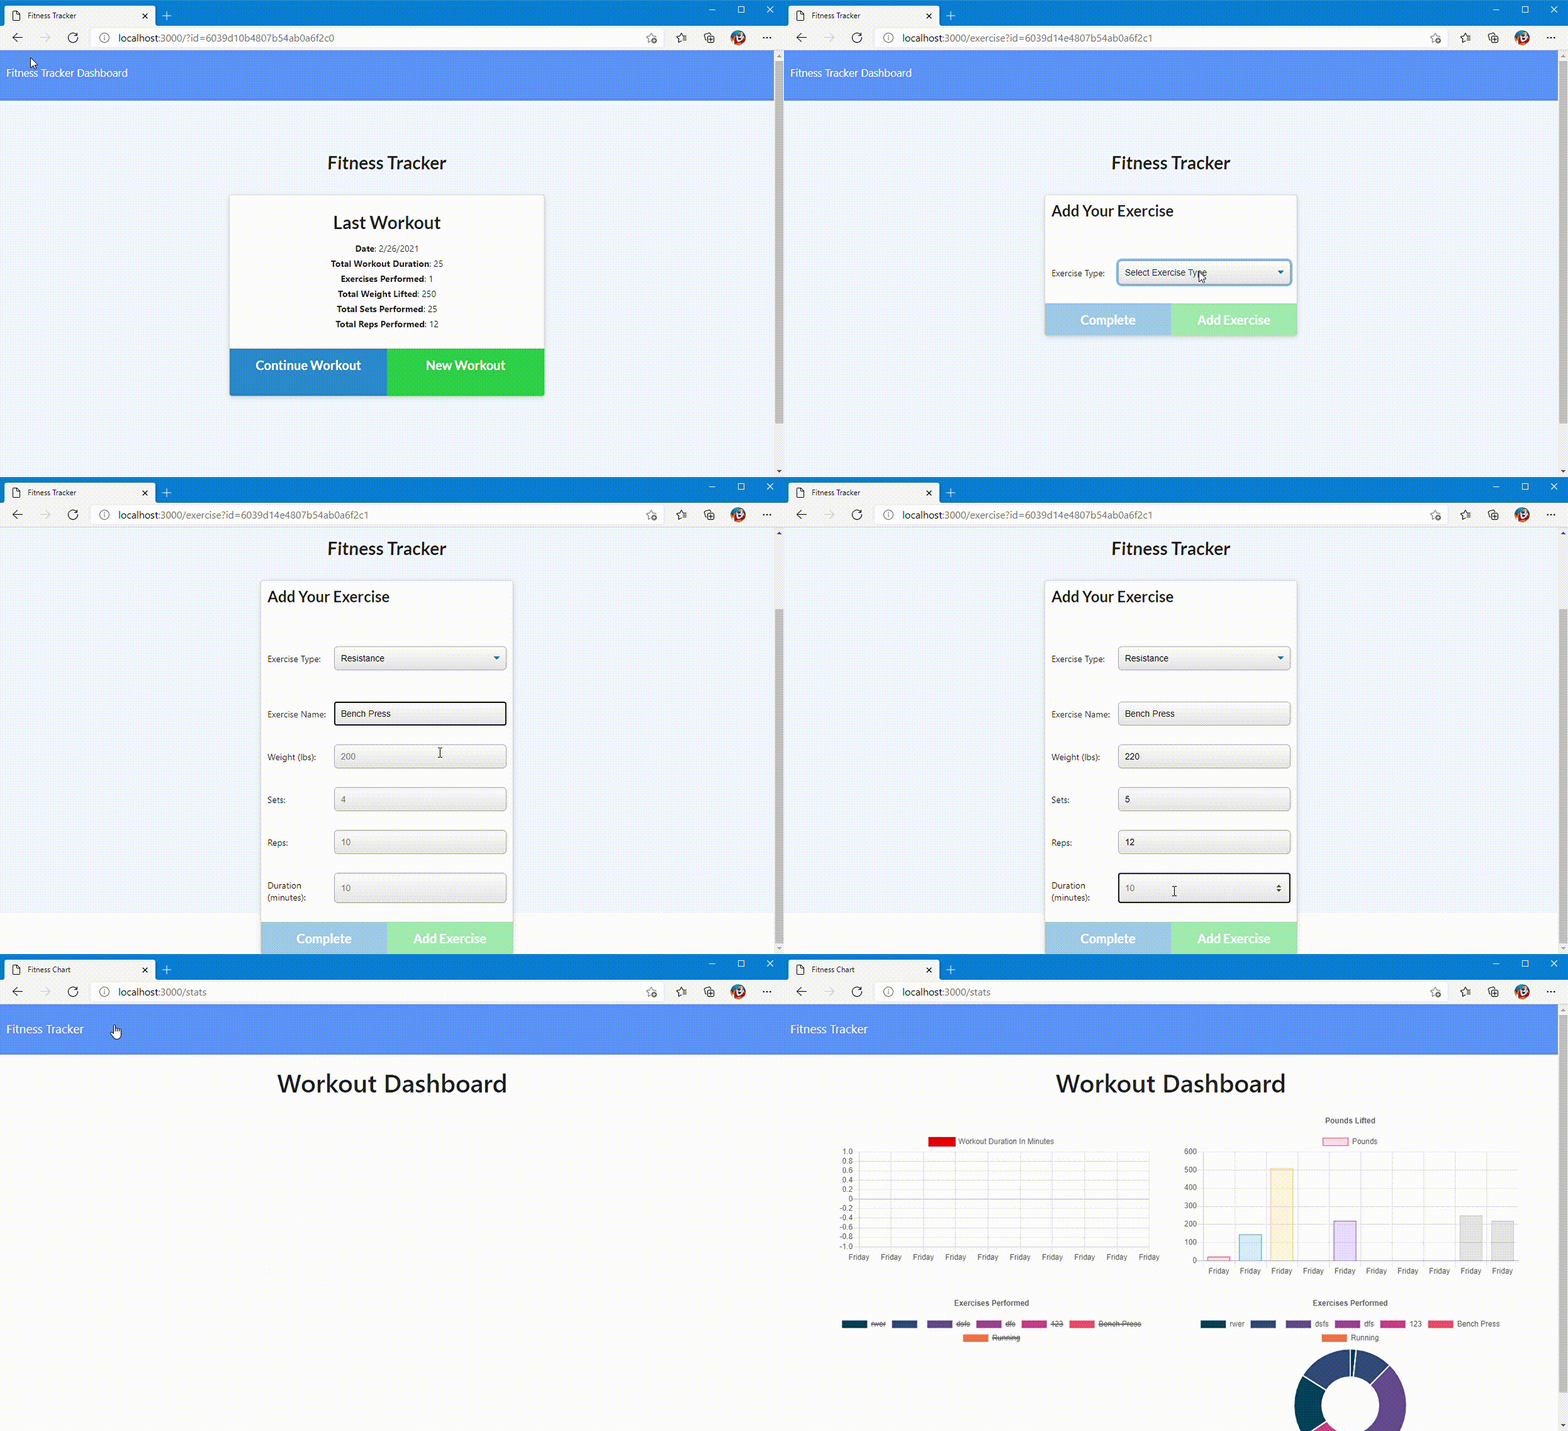
Workout-Tracker
Workout Tracker app using Mongo database with a Mongoose schema and handle routes with Express
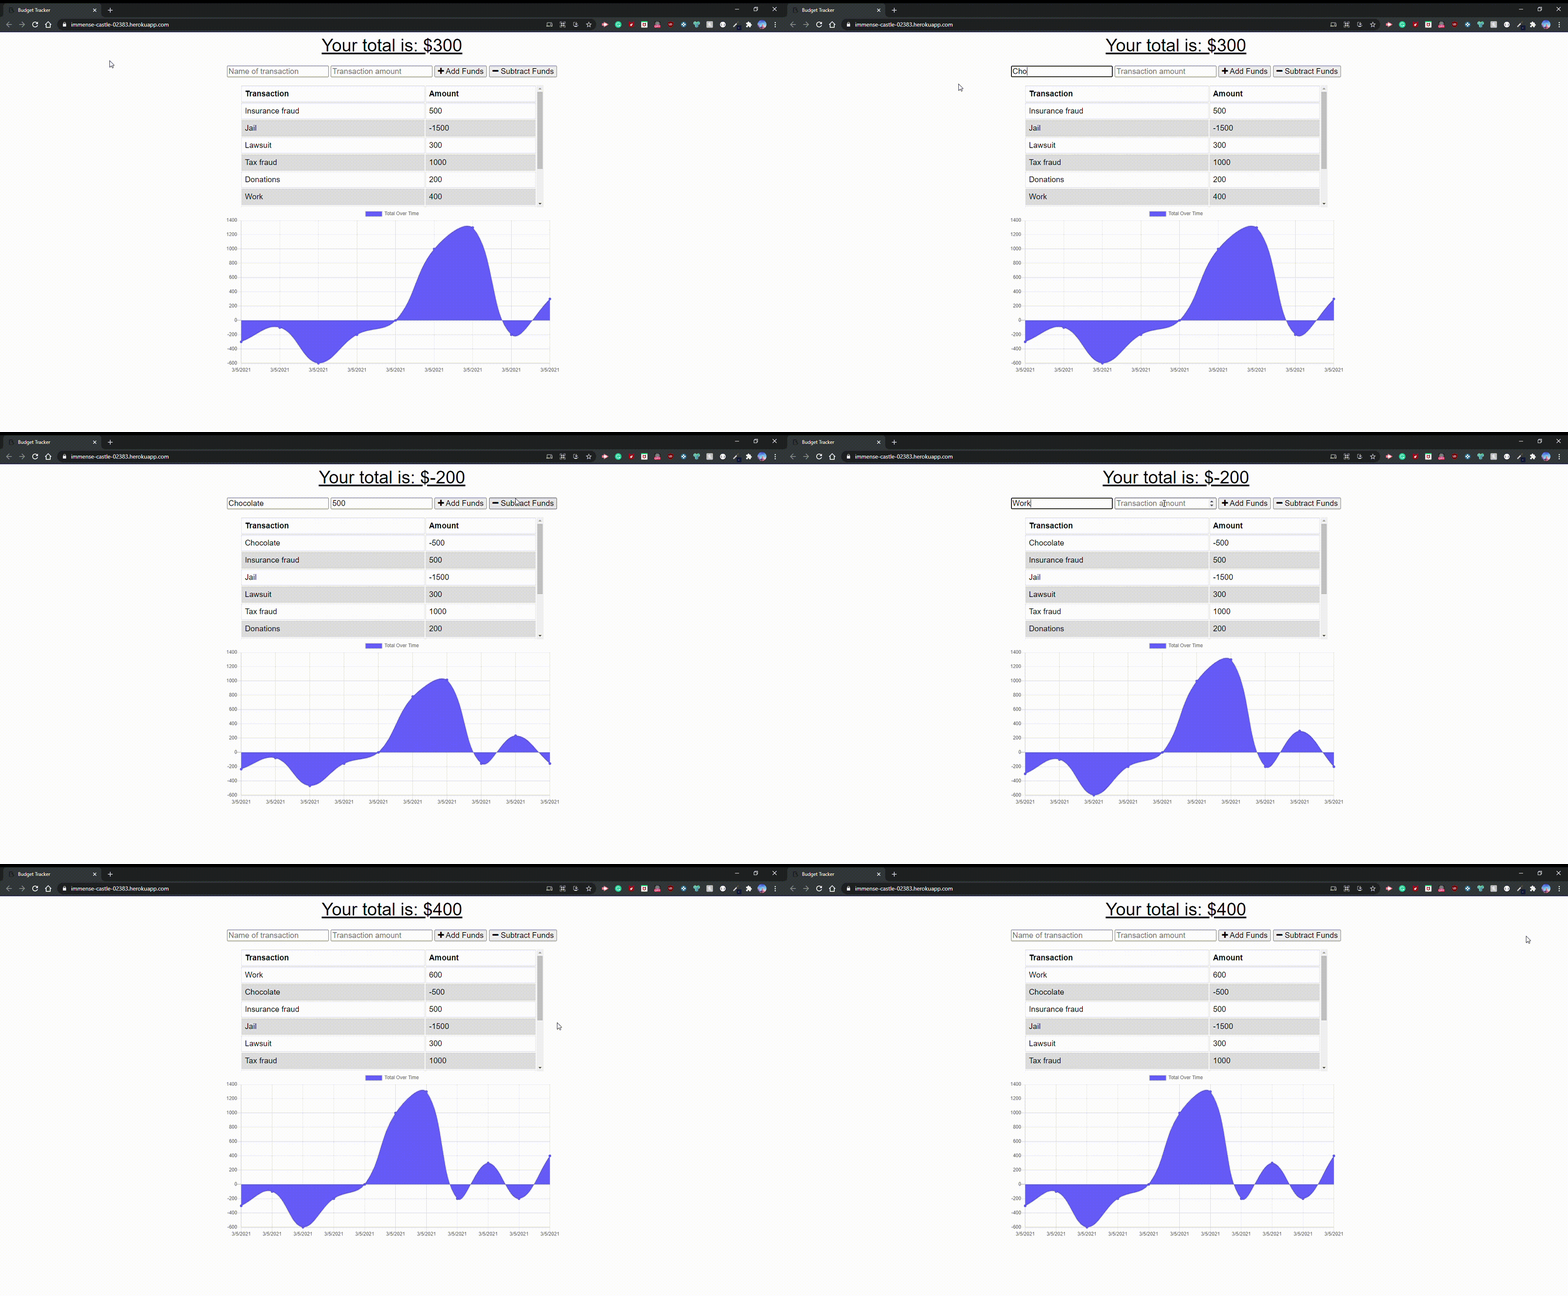
Budget Tracker
Budget Tracker and Calculator - PWA app using Mongo, Mongoose, Express, Morgan for offline use
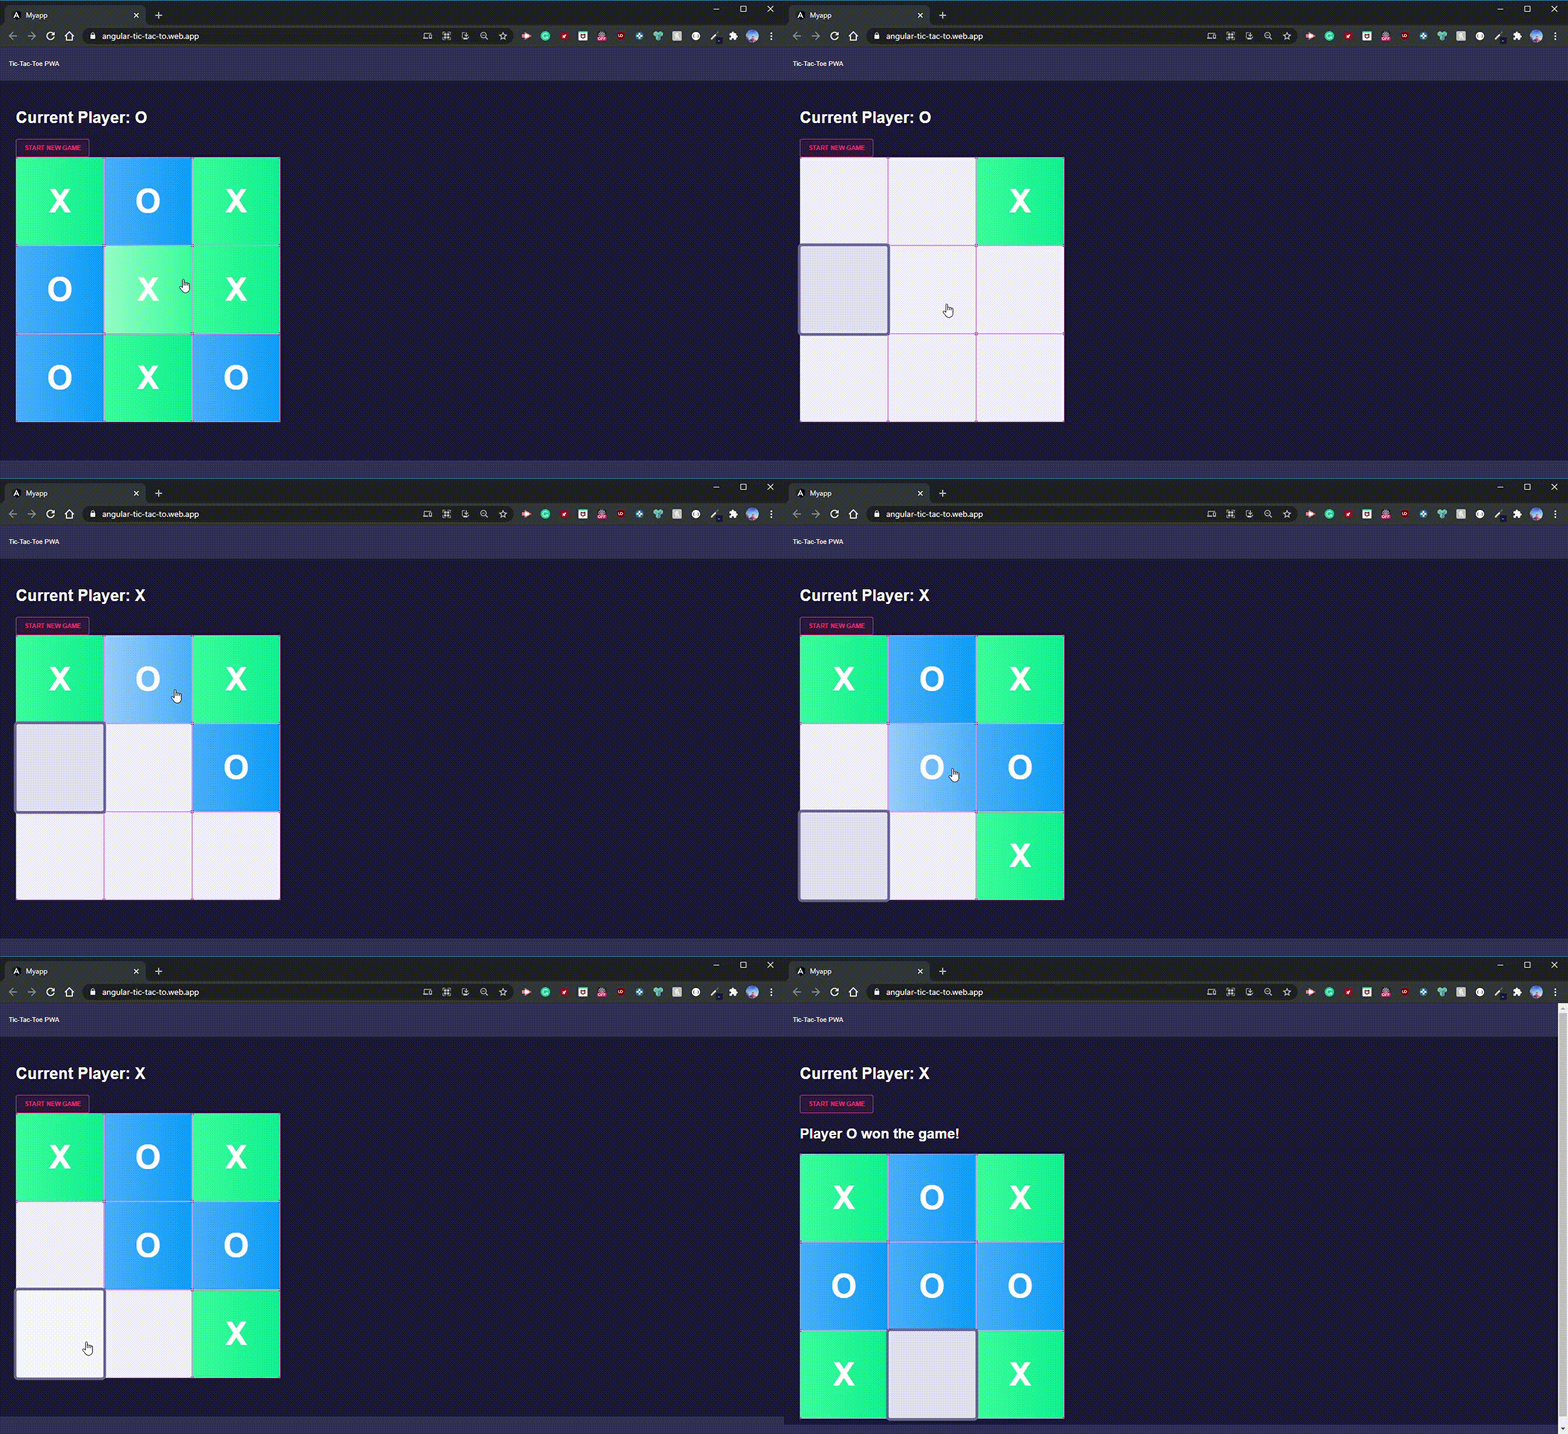
Tic-Tac-Toe
Tic-Tac-Toe game to learn Angular and PWA potential hosted on Firebase
Vue-Chat
A chat app with the ability to record and upload audio from the device. Using Vue routing, Firebase and Tailwind CSS. Under construction

HappyBirthdayWisher
Yay Puppeteer - wish my friends a happy birthday! Fun use of the incredible power of Puppeteer to automate Facebook!
Let's Work Together
Have a project in mind or want to discuss opportunities? I'd love to hear from you. Drop me a message and let's create something amazing together!
